Day 11: Random Number Generation with Perl Data Language

If you want to generate random numbers data easily and fast, you need PDL! (With a little help from the GNU Scientific Library)
"What's a PPR?", asked Santa's chief planner? Santa mumbled, "a premature package release."
"You dropped some packages? How widespread? Where did they go?"
To model this, the planner turned to the PDL::GSL::RNG module. This shows the power of PDL with a concise way to generate graphs of different random number distributions.
use PDL::Graphics::Simple;
use PDL::GSL::RNG;
$x = zeroes(100)->xlinvals(-5,5);
$w = pgswin();
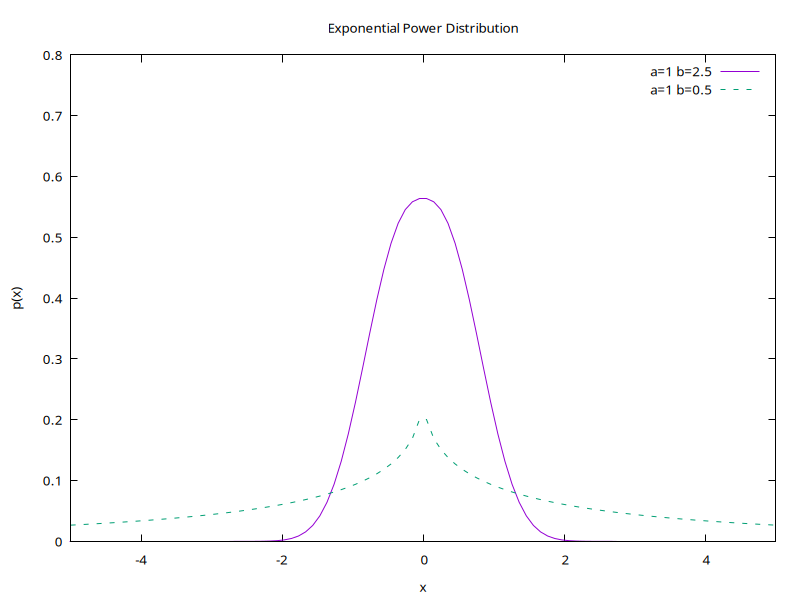
The exponential power distribution is a generalisation of the "normal" (Gaussian) distribution. With β = 1, it's "normal", but there are other values. For example, to model how far away each package might have fallen from the sleigh:
$w->plot(
  with=>'lines', key=>'a=1 b=2.5', $x, ran_exppow_pdf($x, 1, 2.5),
  with=>'lines', key=>'a=1 b=0.5', $x, ran_exppow_pdf($x, 1, 0.5),
  {le=>'tr', yrange=>[0,0.8], title=>'Exponential Power Distribution',
    xlabel=>'x', ylabel=>'p(x)'}
);

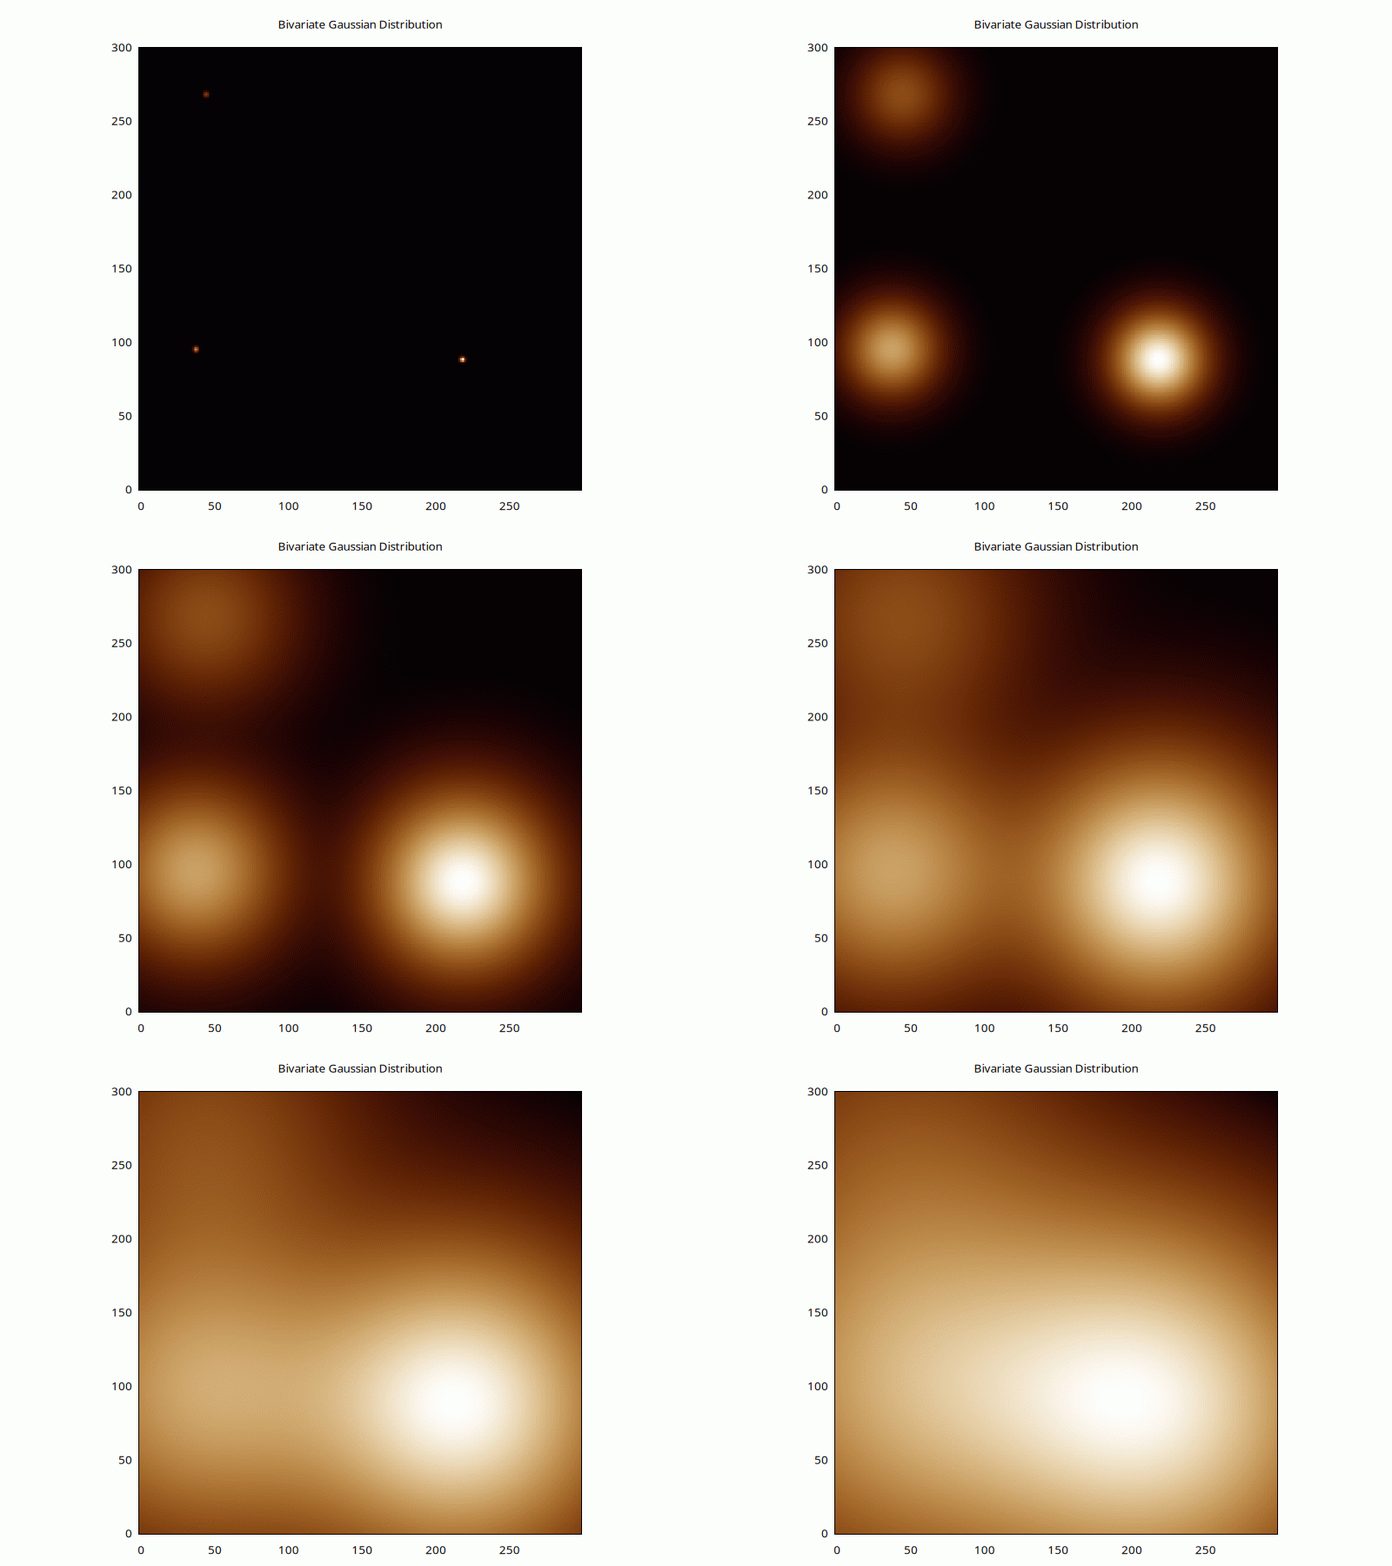
But to model how many packages would have spread out at different heights, we'd use a bivariate Gaussian distribution:
$points = pdl '[219 88 2.7; 38 95 1.7; 45 268 0.8]';
($XSIZE, $YSIZE) = (300, 300);
($xcoord, $ycoord, $weight) = $points       # xyw nweights
  ->slice(",*$XSIZE,*$YSIZE,")              # xyw nx ny nweights
  ->using(0..2);                            # nx ny nweights
$xbase = xvals($XSIZE)->slice(",*$YSIZE");  # nx ny
$ybase = xvals($YSIZE)->slice("*$XSIZE,");  # nx ny
for (1..90) {
  $h = (
    $weight * ran_bivariate_gaussian_pdf(
      $xcoord-$xbase, $ycoord-$ybase, $_, $_, 0
    )                                           # nx ny nweights
  )->mv(-1,0)->sumover;                         # nx ny
  $w->plot(with=>'image', $h, {title=>'Bivariate Gaussian Distribution',j=>1});
}

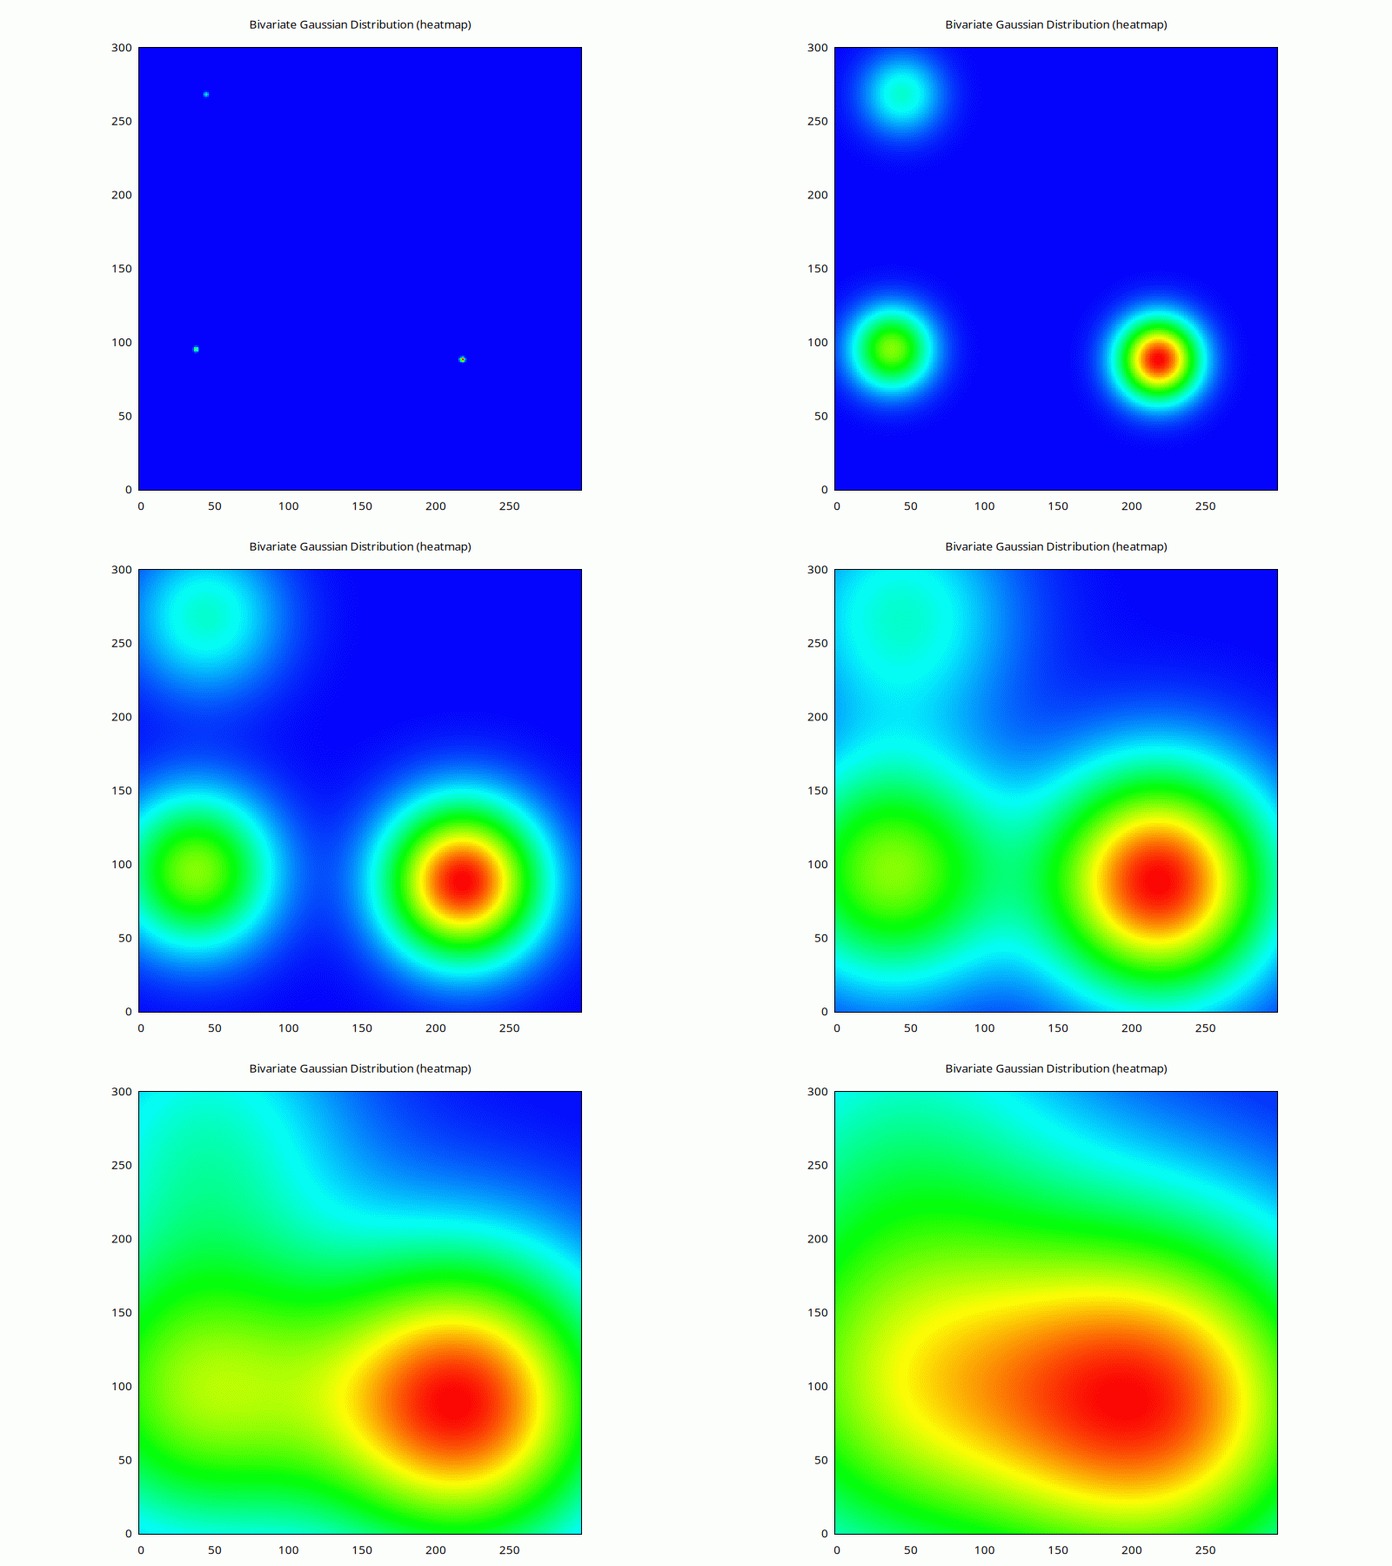
Or, if we have the right libraries, the same but with a colourful heatmap:
sub as_heatmap {
  my ($d) = @_;
  my $max = $d->max;
  die "as_heatmap: can't work if max == 0" if $max == 0;
  $d /= $max; # negative OK
  my $hue   = (1 - $d)*240;
  $d = cat($hue, pdl(1), pdl(1));
  (hsv_to_rgb($d->mv(-1,0)) * 255)->byte->mv(0,-1);
}
if (eval 'use PDL::Graphics::ColorSpace; 1') {
  for (1..90) {
    $h = (
      $weight * ran_bivariate_gaussian_pdf(
        $xcoord-$xbase, $ycoord-$ybase, $_, $_, 0
      )                                           # nx ny nweights
    )->mv(-1,0)->sumover;                         # nx ny
    $w->plot(
      with=>'image', as_heatmap($h),
      {title=>'Bivariate Gaussian Distribution (heatmap)',j=>1}
    );
  }
}

Further resources
See https://www.gnu.org/software/gsl/doc/html/randist.html for more about GSL's random-number distribution capability.
Two red dice Image Credit: Stephen Silver, in the Open Clip Art Library - public domain
Ed J
Ed J (aka "mohawk" on IRC) has been using Perl for a long time. He ported the reference GraphQL implementation from the JavaScript version to Perl. He is currently release manager for PDL.