Day 4: Interpolation with Perl Data Language

If you want to interpolate data easily and fast, you need PDL!
The big night was approaching. Santa needed a refuelling stop over Australia. But when would he get there? And why hadn't they tracked his usual timings in more detail till now?? His chief planner only had a few location/time fixes from previous Christmas eves. Could PDL help again by predicting when he'd get there?
PDL::Func has nice wrappers for interpolation functions; with a few data points, it can generate a description of the path, to trace the points in between. We'll visualise it again with PDL::Graphics::Simple.
We can model Santa's flight just with the time (as input), and his forward distance as output. We could model multiple coordinates, each with time as an input, but we're not going to do that here as it's not needed.
Let's warm up by making a couple of simple graphs of different modes of interpolation, "PCHIP" (Piecewise Cubic Hermite Interpolation - well, you did ask), and B-Spline. Load the necessary modules:
use PDL::Graphics::Simple;
use PDL::Func qw(pchip spline); # load, import convenience functions
$w = pgswin();
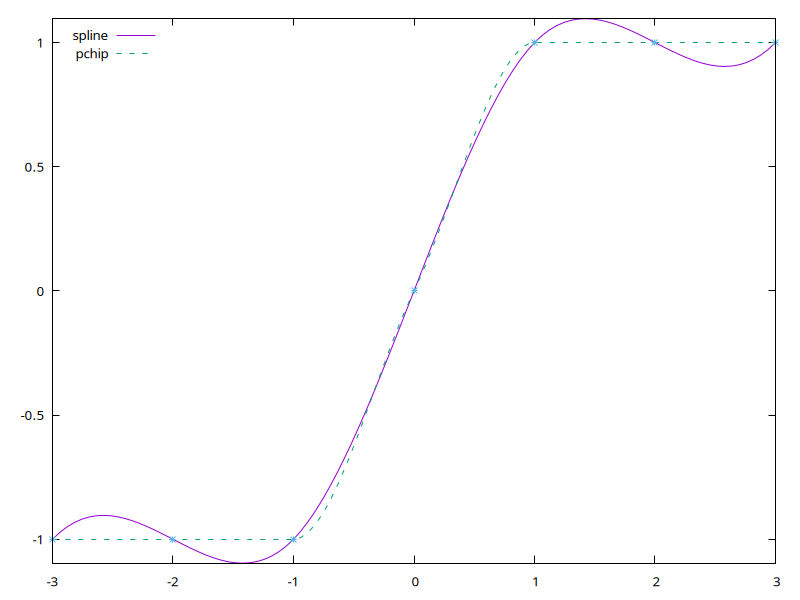
Set up a step function, similar to https://uk.mathworks.com/help/matlab/ref/pchip.html:
$x = sequence(7) - 3;
$y = pdl q[-1 -1 -1 0 1 1 1];
The convenience function "pchip" uses the PDL binding for SLATEC's PCHIP with all the default settings
$xi = zeroes(100)->xlinvals(-3,3);
$yi = pchip($x, $y, $xi);
$yi_s = spline($x, $y, $xi);
$w->plot(with => 'line', key => 'spline', $xi, $yi_s,
  with => 'line', key => 'pchip', $xi, $yi,
  with => 'points', $x, $y,
  {legend=>'tl'});

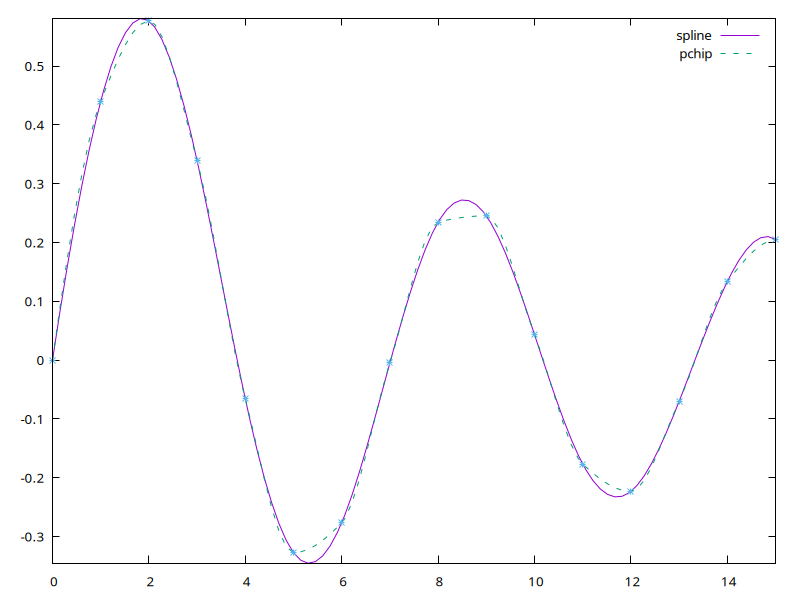
Now a more undulating function, where PCHIP is less effective
$x2 = sequence(16);
$y2 = bessj1($x2);
$xi2 = zeroes(100)->xlinvals(0,15);
$yi2 = pchip($x2, $y2, $xi2);
$yi2_s = spline($x2, $y2, $xi2);
$w->plot(with => 'line', key => 'spline', $xi2, $yi2_s,
  with => 'line', key => 'pchip', $xi2, $yi2,
  with => 'points', $x2, $y2,
  {legend=>'tr'});

Our planner looks at the curves, and her gut tells her Santa's flight
will have behaved more like the spline function than the pchip one -
he's a supernatural elf, not a UFO! She carefully plots the known times
and distances from distance 0 - Australia is at distance 20,000km:
$santacoords = pdl '[0 0; 3 8000; 7 10000; 8 11000; 11 15000;
  13 21000; 18 30000; 22 35000]';
($t, $dist) = $santacoords->using(0,1);
$ti = zeroes(100)->xlinvals(0,22);
$disti = spline($t, $dist, $ti);
$w->plot(with => 'line', key => 'spline', $ti, $disti,
  with => 'points', $t, $dist,
  {legend=>'tr', xlabel=>"Time (hours)", ylabel=>"Distance (km)"});

OK, that looks good. Now to calculate then plot the closest time to 20,000km:
$disti_20k = abs($disti-20_000);
$closest_ind = $disti_20k->minimum_ind;
print "Time: ", $closest_time = $ti->index($closest_ind), "\n";
print "Dist: ", $closest_dist = $disti->index($closest_ind), "\n";
$w->oplot(with => 'line', style=>4,
  $closest_time->dummy(0,2), pdl(0,$closest_dist));
# Time: 12.6666666666667
# Dist: 19980.2751270675

12 hours and 40 minutes after take-off it is!
Further resources
Be sure to check the documentation for PDL::Func, to see further possibilities: PDL::Func objects encapsulate data to interpolate, integrate, and get gradients of (differentiate).
Santa Claus with coronavirus mask on NORAD's 2020 tracker. Image Credit: NORAD, so public domain
Ed J
Ed J (aka "mohawk" on IRC) has been using Perl for a long time. He ported the reference GraphQL implementation from the JavaScript version to Perl. He is currently release manager for PDL.