Day 2: Maps with Perl Data Language

If you want to visualise or transform cartographic data, you need PDL!
Santa's chief planner knew she had to have good visuals that even the reindeer could understand. Maybe this time they wouldn't get lost again! She read the introduction to PDL article - maybe that could help?
PDL::Transform::Cartography includes a global earth vector coastline map and night and day world image maps, as well as the infrastructure for transforming them to different coordinate systems. PDL::Graphics::Simple lets you see the results easily.
Load the necessary modules:
use PDL::Graphics::Simple;
use PDL::Transform::Cartography;
Get the vector coastline map (and a lon/lat grid), and load the Earth RGB daytime image -- both of these are built-in to the module. The coastline map is a set of (X,Y,Pen) vectors:
$coast = earth_coast()->glue( 1, scalar graticule(15,1) );
print "Coastline data are a collection of vectors:  ",
         join("x",$coast->dims),"\n";
$map = earth_image('day');
print "Map data are RGB:   ",join("x",$map->dims),"\n\n";
Output:
Coastline data are a collection of vectors:  3x27065
Map data are RGB:   2048x1024x3
Map data are stored natively in Plate Carree format. The image contains a FITS header that contains coordinate system info.
print "FITS HEADER INFORMATION:\n";
for $_(sort keys %{$map->hdr}){
  next if(m/SIMPLE/ || m/HISTORY/ || m/COMMENT/);
  printf ("  %8s: %10s%s", $_, $map->hdr->{$_}, (++$i%3) ? "  " : "\n");
}
print "\n";
Output:
FITS HEADER INFORMATION:
  CDELT1: 0.17578125      CDELT2: 0.17578125      CDELT3: 0.666666666666667
  CRPIX1:     1024.5      CRPIX2:      512.5      CRPIX3:          1
  CRVAL1:          0      CRVAL2:          0      CRVAL3:          0
  CTYPE1:  Longitude      CTYPE2:   Latitude      CTYPE3:        RGB
  CUNIT1:    degrees      CUNIT2:    degrees      CUNIT3:      index
   NAXIS:          3      NAXIS1:       2048      NAXIS2:       1024
  NAXIS3:          3
Show the results:
$w = pgswin();
$w->plot(with=>'fits', $map, {Title=>"NASA/MODIS Earth Map (Plate Carree)",J=>0});
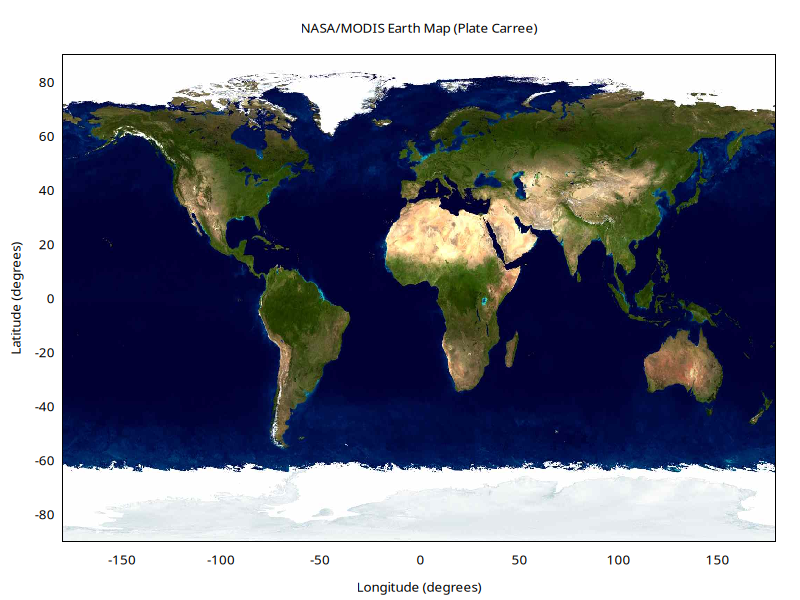
The map data are co-aligned with the vector data, which can be drawn
on top of the window with the with polylines plot type. The
clean_lines method breaks lines that pass over the map's singularity
at the 180th parallel.
$w->hold;
$w->plot(with=>'polylines', $coast->clean_lines);
$w->release;
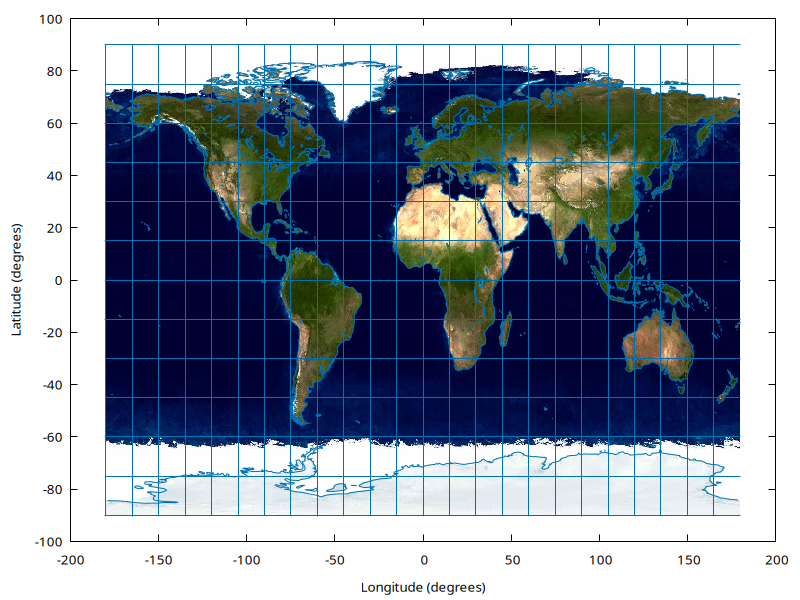
The
or curve option specifies the output range of the mapping.
There are a large number of map projections -- to list them all,
say "??cartography" in the perldl shell.
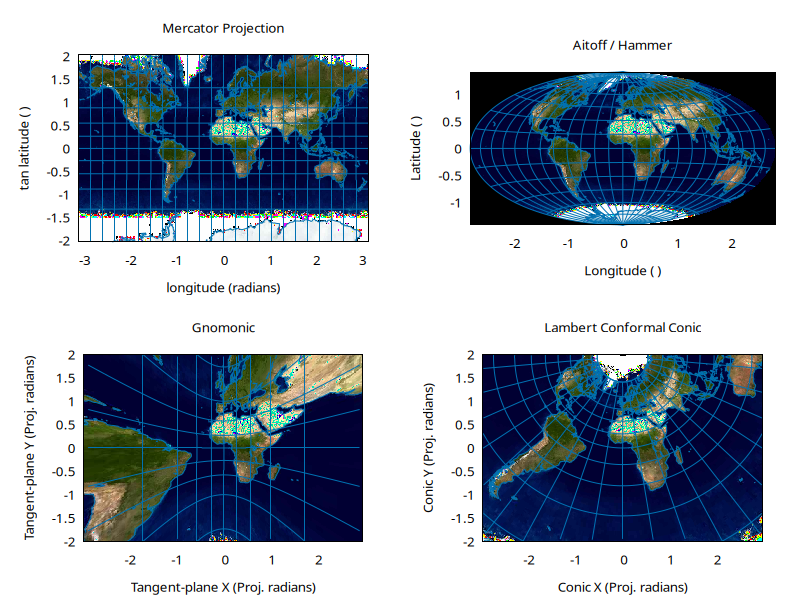
Here are four of them:
undef $w; # Close old window
$w = pgswin( size=>[8,6], multi=>[2,2] ) ;
sub draw {
 ($tx, $t, $px, @opt ) = @_;
 $w->plot(with=>'fits', $map->map( $tx, $px, @opt ),
   with=>'polylines', $coast->apply( $tx )->clean_lines(@opt),
   {Title=>$t, J=>1});
}
draw( t_mercator,  "Mercator Projection",    [400,300] );
draw( t_aitoff,    "Aitoff / Hammer",        [400,300] );
draw( t_gnomonic,  "Gnomonic",               [400,300],{or=>[[-3,3],[-2,2]]} );
draw( t_lambert,   "Lambert Conformal Conic",[400,300],{or=>[[-3,3],[-2,2]]} );
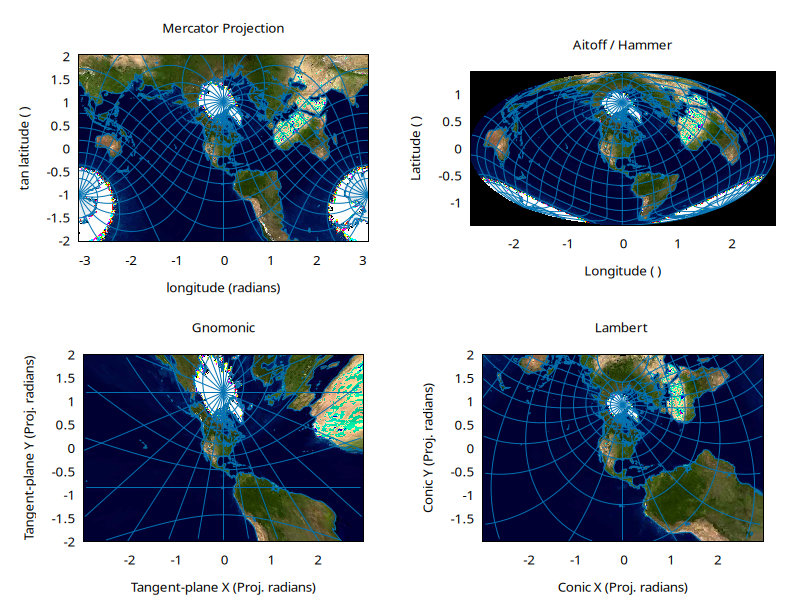
You can create oblique projections by feeding in a different origin. Here, the origin is centered over North America.
draw( t_mercator(  o=>[-90,40] ), "Mercator Projection",    [400,300] );
draw( t_aitoff (   o=>[-90,40] ), "Aitoff / Hammer",        [400,300] );
draw( t_gnomonic(  o=>[-90,40] ), "Gnomonic",[400,300],{or=>[[-3,3],[-2,2]]} );
draw( t_lambert(   o=>[-90,40] ), "Lambert ",[400,300],{or=>[[-3,3],[-2,2]]} );
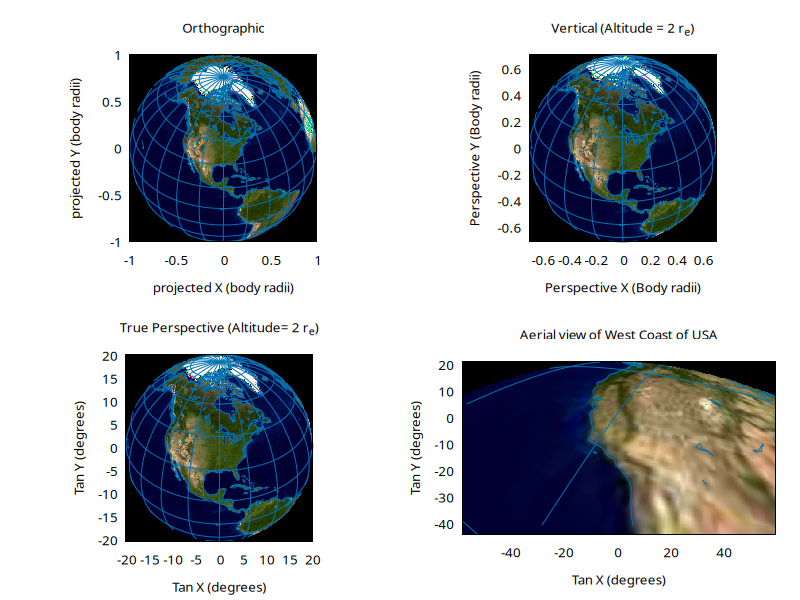
There are three main perspective projections (in addition to special cases like stereographic and gnomonic projection): orthographic, vertical, and true perspective. The true perspective has options for both downward-looking and aerial-view coordinate systems.
draw( t_orthographic( o=>[-90,40] ),
      "Orthographic",  [400,300]);
draw( t_vertical( r0=> (2 + 1), o=>[-90,40] ),
      "Vertical (Altitude = 2 r_e)", [400,300]);
draw( t_perspective( r0=> (2 + 1), o=>[-90,40] ),
      "True Perspective (Altitude= 2 r_e)", [400,300]);
Observer is 0.1 earth-radii above surface, lon 117W, lat 31N (over Tijuana). view is 45 degrees below horizontal, azimuth -22 (338) degrees:
draw( t_perspective( r0=> 1.1, o=>[-117,31], cam=>[-22,-45,0] ),
      "Aerial view of West Coast of USA", [400,300],
      {or=>[[-60,60],[-45,45]], method=>'linear'});
This is all very well, she thought. But what about the van der Grinten projection? What about the Gauss-Schreiber Transverse Mercator?? But it was OK! PDL::Transform::Proj4 has your back.
use PDL::Transform::Proj4;
sub draw2 {
 ($tx, $t, $px, @opt ) = @_;
 $tx = t_scale(1/6378135, iunit=>'metres', ounit=>'radii') x $tx;
 $w->plot(with=>'fits', $earth->map( $tx, $px, @opt ),
   with=>'polylines', clean_lines($coast->apply($tx), $pen, @opt),
   {Title=>$t});
}
draw2( t_proj_murd3(lat_1=>30, lat_2=>50), "Murdoch III", [400,300]);
draw2( t_proj_vandg, "van der Grinten (I)", [400,300]);
draw2( t_proj_gstmerc, "Gauss-Schreiber Transverse Mercator", [400,300]);
draw2( t_proj_som(inc_angle=>98, ps_rev=>0.06, asc_lon=>64),
  "Space Oblique Mercator", [400,300]);

Well, she thought. That should show them where to go. But how does this "transform" thing actually work? Stay tuned to find out in future installments!
Further resources
Take a look at https://proj.org/en/stable/operations/projections/index.html for more from PROJ!
Map of the world from 1565 in the public domain
Ed J
Ed J (aka "mohawk" on IRC) has been using Perl for a long time. He ported the reference GraphQL implementation from the JavaScript version to Perl. He is currently release manager for PDL.